Cross-LLM Brand Citation Share-of-Voice Tracking From a Single Dashboard
Measure your brand's presence across ChatGPT, Claude, and Perplexity together.

A unified platform that tracks brand visibility across multiple LLMs at once must bring shared query sets, per-engine citation share, competitive benchmarks, and accuracy monitoring into one dashboard. Cross-LLM brand citation share-of-voice tracking requires a different architecture from traditional rank tracking because AI engines produce different answers from different source pools. The dashboard must preserve those differences while connecting them to content decisions and business outcomes.
Why brand visibility measurement broke when AI search arrived
GA4 records an AI referral only when an engine provides a source link and the user follows it. Much AI-influenced behavior instead arrives as Direct traffic, leaving no measurable signal of the engine’s contribution. A brand may shape an answer that influences a buyer without receiving a click that analytics can identify.
Traditional rank tracking measures position on a results page, leaving inclusion in a synthesized answer unmeasured. Its architecture assumes a search surface, an engine, and a click-through event. AI search breaks that measurement model at its foundation. A marketing team can therefore have complete rank data while remaining blind to what AI engines say about its brand, which competitors they recommend, and which relevant answers omit it.
Why tracking one LLM is not the same as tracking AI search
The citation pools of major LLMs differ enough that success on one engine cannot stand in for performance across AI search. ChatGPT and Perplexity draw on largely distinct sets of cited domains, so strong visibility in one can coexist with near-invisibility in the other. This is not merely variation around a common result. It reflects differences in how engines find and use information.
Perplexity and Google AI Mode rely heavily on live retrieval, making their citations closely connected to what ranks in their underlying indexes. ChatGPT historically relied more on training-data recall, although its Search mode has narrowed that difference. Claude shows a preference for long-form editorial from established publications and for academic and institutional sources. Google AI Overviews also give a substantial share of citations to YouTube. These sourcing differences make a single-engine score an incomplete competitive picture.
Even within one engine, citation frequency does not establish influence. The Princeton/Georgia Tech GEO research separates citation from absorption, which is how much the source’s information adds to the answer itself. A footnote may contribute little to the answer. Monitoring must therefore track both when a brand is named and how it shapes what the buyer reads, since citations differ in how much they influence the answer.
What "share of voice" actually means in an AI citation context
AI visibility measures how often a brand appears in answers to a defined set of relevant queries. AI share of voice measures the brand’s portion of all brand citations within that test set. The denominator changes the meaning of the result. Visibility describes presence, while share of voice describes presence relative to competitors named in the same answers.
Share of Voice = (brand citations ÷ total citations across all brands in the test set) × 100.
That calculation needs an explicit query set and competitive set to remain interpretable. Without them, a reported share lacks the context needed to explain what the brand has gained or lost. A blended score also conceals important differences between engines. A strong showing on Perplexity can hide a weak one on ChatGPT, even when the overall score looks good.
Sentiment adds a quality gate to that competitive measure. Frequent citations describing a product as expensive or difficult are not an unqualified visibility win. More mentions can expose an unfavorable brand frame. A useful measurement system therefore keeps absolute visibility, relative share, answer absorption, and sentiment distinct.
How can one dashboard make brand tracking across ChatGPT, Claude, and Perplexity coherent?
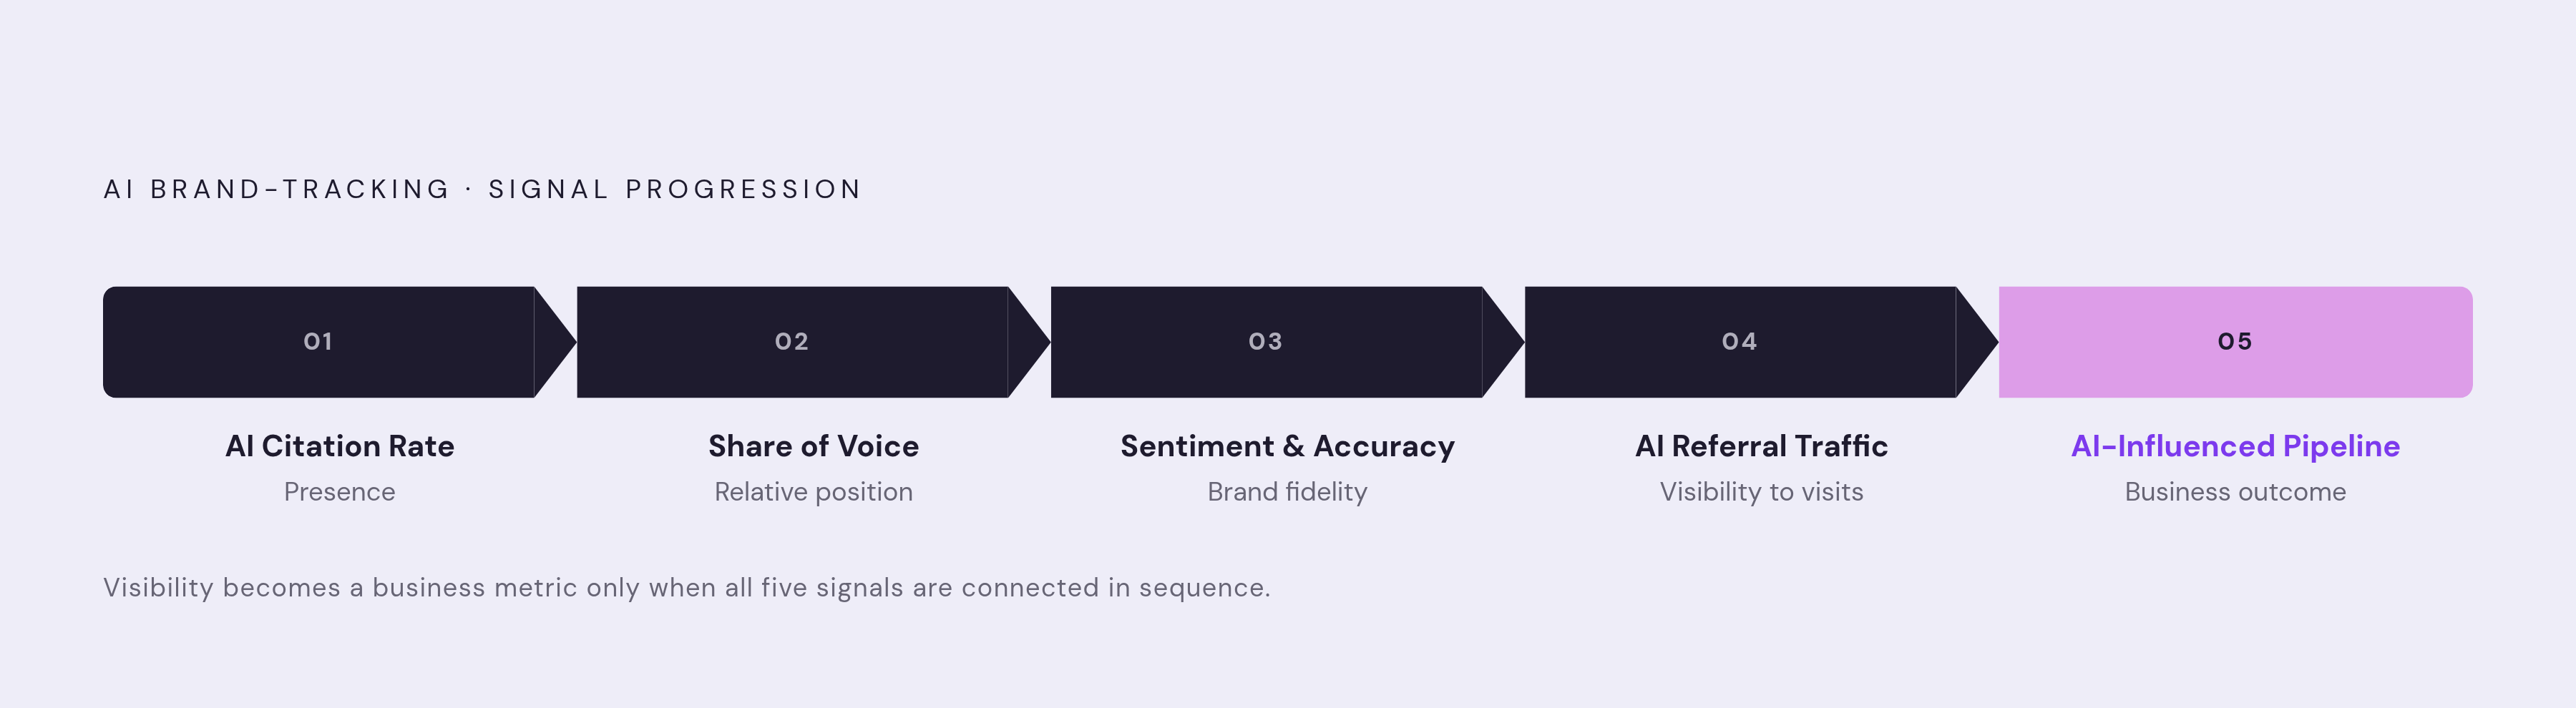
Each engine requires its own query execution, citation parsing, and competitive benchmarking. A purpose-built platform brings those workflows into one measurement system while retaining the differences between their outputs. The shared framework is the essential architectural choice. Running manual checks in ChatGPT, then Perplexity, then Gemini produces separate snapshots.
A unified architecture must capture five signals concurrently across engines. These are AI citation rate, competitive share of voice, sentiment and accuracy, AI referral traffic, and AI-influenced pipeline. Citation rate establishes presence, share of voice establishes relative position, and sentiment and accuracy establish whether that presence represents the brand correctly. Referral traffic and pipeline then link visibility in answers to what buyers do next, even when an answer shapes a buyer’s choice without a click that can be traced.
The dashboard must keep per-engine views within that framework. A Perplexity share that dwarfs a ChatGPT share calls for different remediation on each engine, which a blended report cannot reveal. History is just as important as breadth. Continuous tracking stores query results over time to expose trends and anomalies, while point-in-time AEO checking examines the answers available at a particular moment. A mature platform uses both and keeps a series of separate checks distinct from tracking over time.
What the dashboard must surface to be strategically useful, not just informational
For buyers evaluating a platform, engine coverage is the first test because missing engines create blind spots that no reporting interface can repair. A tool that covers only one or two engines tracks just part of what cross-LLM tracking is meant to cover. The dashboard must compare the brand with competitors appearing in the same answers, so that a rising citation count does not obscure a weaker competitive share.
That comparison also needs to identify the queries behind the result. Content gap analysis shows which category questions get answers that leave out the brand, giving the team a way to decide where new content might help. Query libraries and prompt templates make setup easier and help the test set match how buyers do research, instead of using phrases picked because they are easy to run.
Accuracy monitoring must sit alongside those views of competitors and queries. Otherwise, the platform can report favorable counts while engines misstate product descriptions, pricing, or capabilities. The interface must also make the distinction readable to non-technical stakeholders, because a CMO needs to understand both the performance signal and the reason for acting on it. Reports that cannot help with a budget decision give the team information without helping it decide where to spend.
How hallucinations and inconsistent brand signals corrupt the SOV data a dashboard is measuring
A citation count records an appearance regardless of the accuracy of the description attached to it. If an engine repeatedly misrepresents the brand, a higher mention rate can amplify the error. This compromises both measurement integrity and reputation. The dashboard’s accuracy function must distinguish genuine competitive visibility from repeated circulation of incorrect claims.
Inconsistent third-party descriptions create an upstream source of that uncertainty. AI engines synthesize mentions across sources to form a kind of parametric consensus about a brand. Conflicting profiles make that consensus less dependable. When descriptions differ across G2, Capterra, LinkedIn, Crunchbase, and trade directories, the engine lacks a consistent account to anchor its synthesis and may fill the gaps incorrectly.
A team addressing those inconsistencies should deploy a single authoritative brand description, verbatim, across its third-party profiles. Owned content also needs a clear website structure. When that structure is confusing, AI crawlers can fill missing information with inference. Accuracy monitoring belongs inside the dashboard because it reveals whether the visibility being measured rests on a dependable description of the business.
What content changes actually increase citation share across LLMs
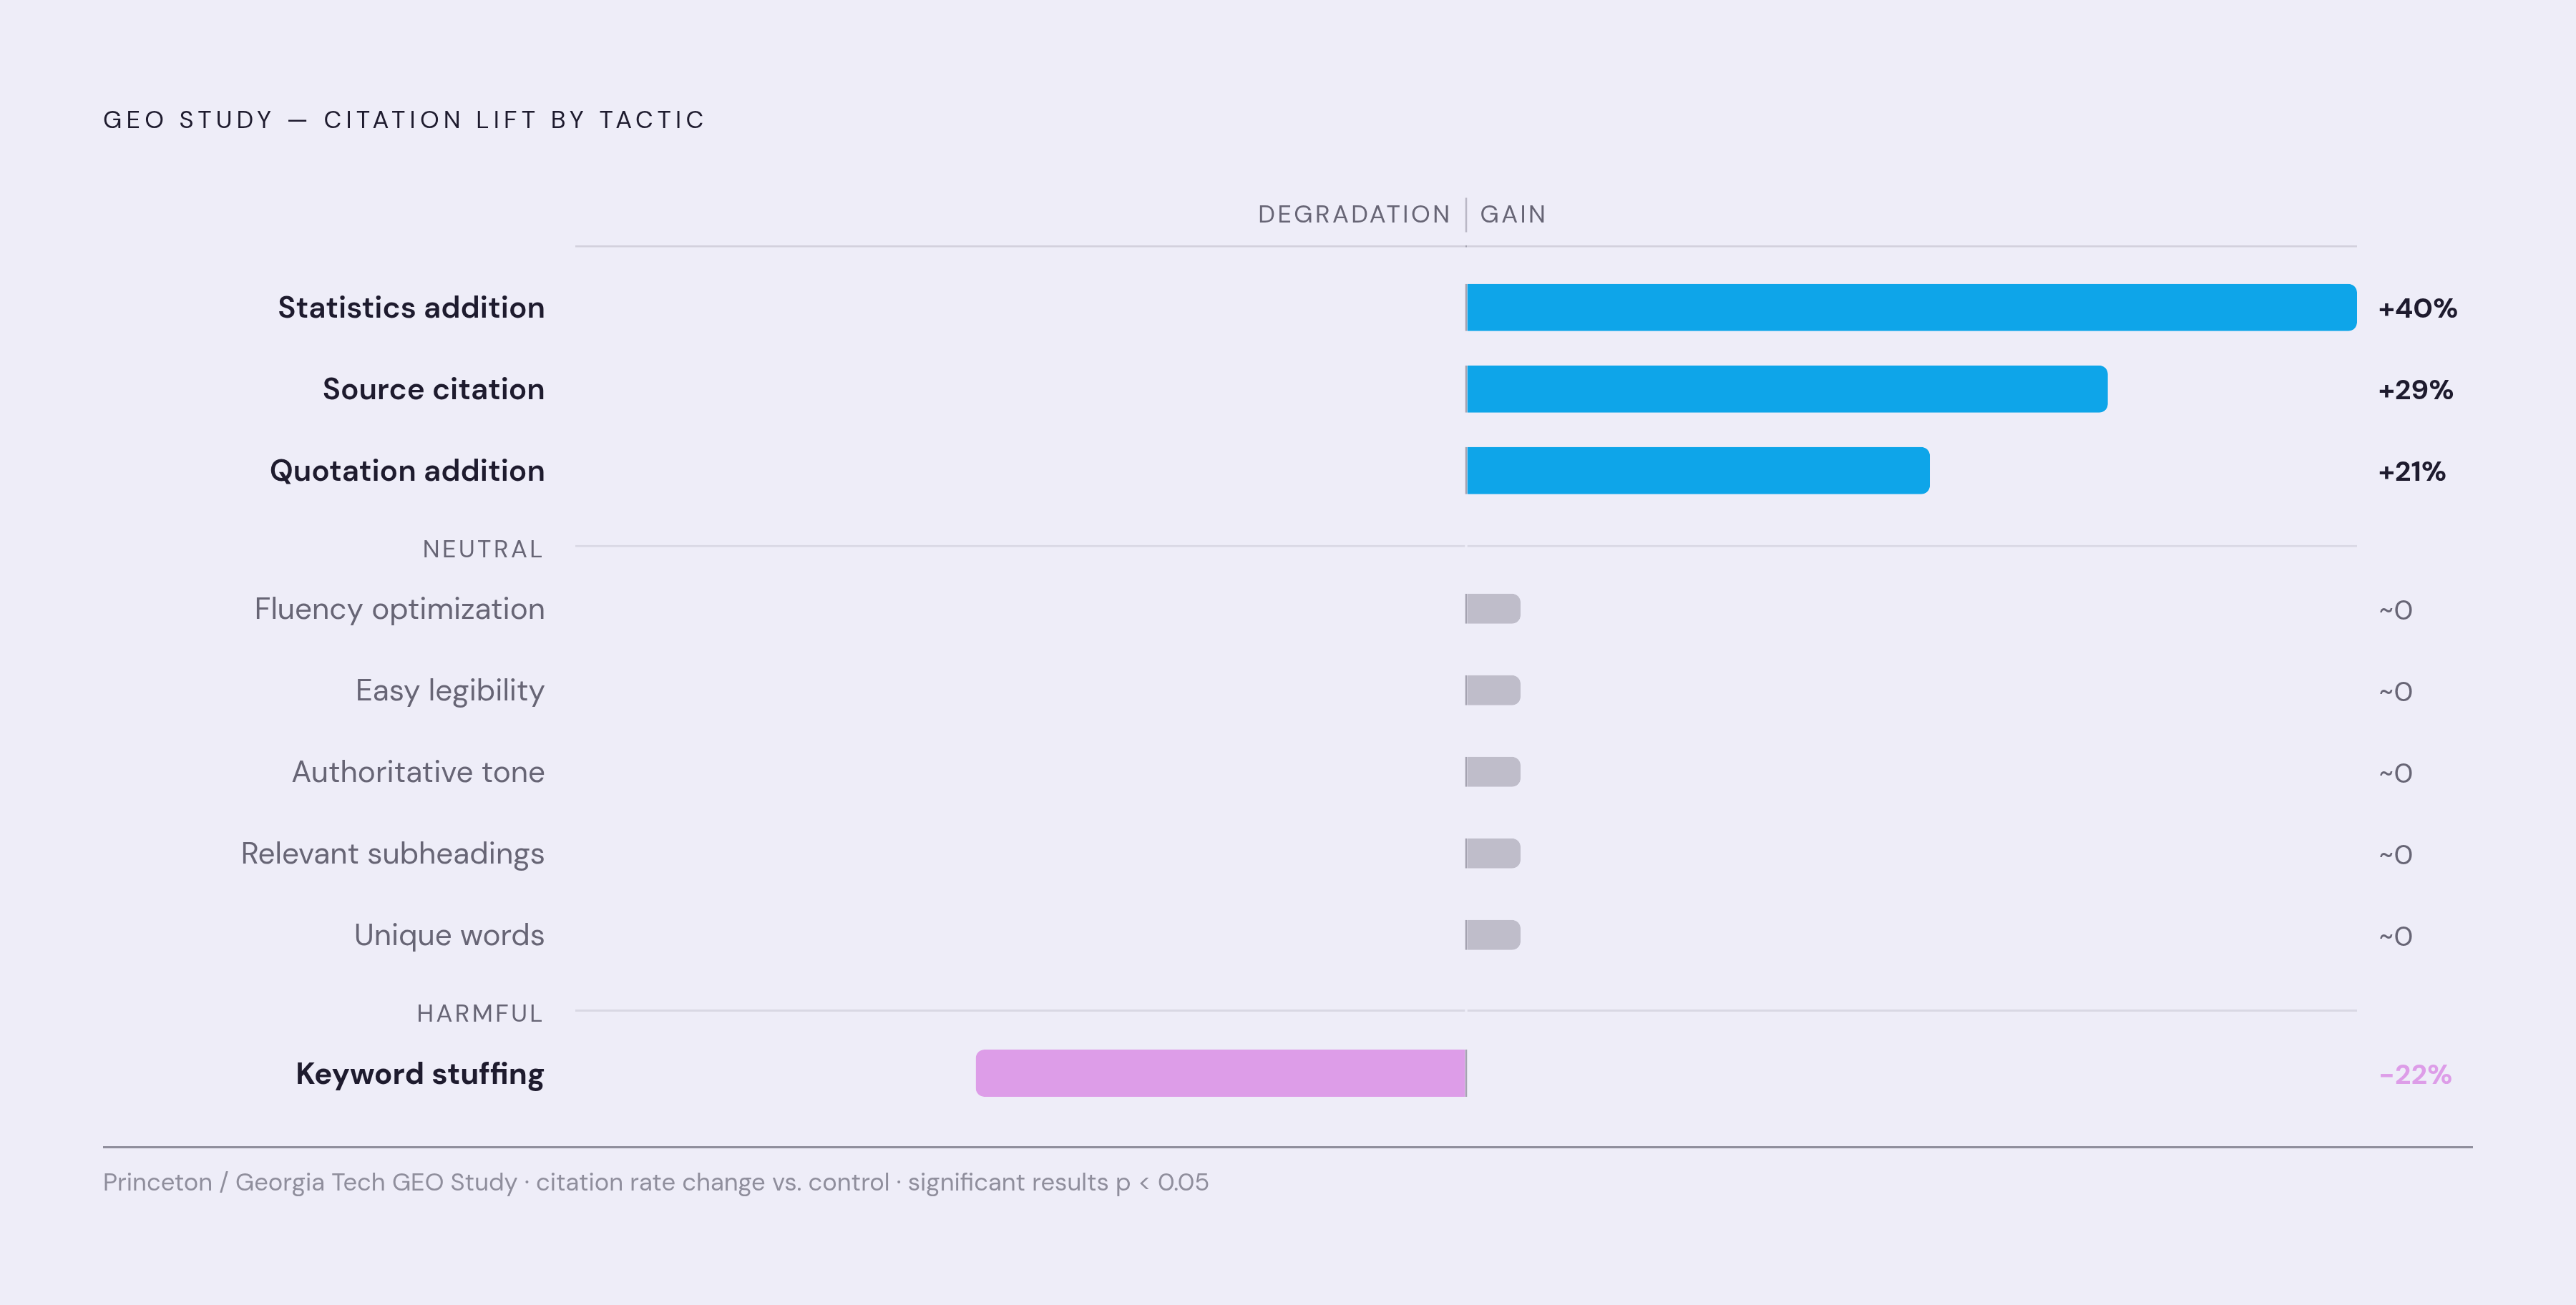
The Princeton/Georgia Tech study tested nine ways to optimize content and found statistically significant gains in citations from adding statistics, citing authoritative sources, and adding quotations. Keyword stuffing, by contrast, produced measurable performance degradation. The findings favor evidence over repeated target phrases. They also give practitioners a more precise optimization basis than the general instruction to publish good content.
Statistics addition replaces qualitative descriptions with quantitative specifics that generative engines can use as ground-truth anchors. Source citation optimization cites authoritative external domains in owned content to help the retrieval layer see it as credible. Quotation addition adds the exact words of named authoritative sources. Each tactic makes the supporting evidence more explicit, but none removes the need to assess how the engine actually uses it.
A source can earn a reference without supplying much of the answer, so frequency alone cannot establish that a content change strengthened influence. Sentiment remains a separate quality gate as well. A page that generates more citations within an unfavorable description of the brand has not necessarily improved the result the team intended to achieve.
Content structure helps answer engines find information they can use. The recommended pattern places a direct question in the heading, supplies a definition in the first two sentences, and then expands the context. Lists, tables, and step-by-step structures support clean extraction. Rendering speed is a separate technical gate because real-time AI crawlers can bypass high-latency pages regardless of their content quality.
The dashboard’s content gap analysis makes these changes responsive to category queries that return answers without a brand citation, giving the team a basis for prioritizing briefs. Those gaps should drive the content calendar. Per-engine reporting then preserves the context needed to judge whether the resulting content is improving visibility where the shortfall was identified, rather than merely raising an aggregate count elsewhere.
How to frame AI citation share of voice as a business metric for executive audiences
For executive audiences, AI citation share of voice is best framed as a leading indicator that moves before pipeline. Its role resembles that of brand awareness and share of search in earlier measurement models. It describes competitive position before the commercial outcome arrives. That framing gives the metric a business purpose without claiming that every additional citation produces a measurable sale.
The attribution gap requires explicit treatment in the report. AI engines send limited referral traffic, and much AI-influenced behavior reaches GA4 as Direct, so last-click reporting undercounts the channel’s contribution. Seer Interactive’s June 2025 analysis found that visitors from AI referral sources converted at much higher rates than visitors from organic search. That conversion premium gives modest referral volumes commercial significance and provides a downstream anchor for the leading-indicator argument.
The executive report should identify observed outcomes and estimates separately. Structured dashboard exports can link citation trends to estimates of pipeline and revenue while showing the limits of attribution. For a CMO, this connects competitive visibility with investment priorities. For a CEO, the report narrows to revenue, cost, payback period, and growth trajectory, with citation counts in the appendix.
Board-ready reporting is consequently part of the measurement architecture. It lets the team discuss spending on AI search in terms of business outcomes while keeping the evidence from each engine behind the proposal. Without that link, the team has no usable scoreboard to guide budget decisions.


