The Hidden Cost of Rotating Through LLM Tabs to Check Your Own Brand Rankings
Manual tab-checking yields a blended, short-lived view that misleads strategy.

A unified platform for tracking brand visibility across multiple LLMs must preserve per-engine share of voice, distinguish citations from mentions, and monitor accuracy across a defined prompt cluster over time. Rotating through ChatGPT, Claude, Gemini, and Perplexity tabs cannot provide that intelligence reliably. The hidden cost is not the time spent checking answers, but the decisions made from a blended, perishable picture of brand visibility.
Why tab-switching to check AI brand visibility is not just slow but structurally wrong
A marketer opens ChatGPT, enters a category query, copies the answer into a spreadsheet, and repeats the exercise in Gemini and Perplexity. Each tab adds another result to the record. The process looks rigorous because it touches multiple platforms, and the spreadsheet gives the outputs a common form. But that form conceals a methodological failure. It treats each answer as a stable observation that can be compared with the next and acted on later.
A manual session records one point on a moving line, without establishing how representative that point is. More tabs broaden the sample without resolving that uncertainty. The team leaves with what looks like competitive intelligence, although the evidence supports only a narrower statement about the answers returned during that session.
How each major AI engine surfaces brands differently, and why the same brand looks unrecognizable across platforms
The platforms are not interchangeable instruments measuring the same thing. Perplexity and Google AI Mode are retrieval-heavy, drawing on live web results, so brand visibility depends on what ranks in the underlying index at query time. ChatGPT has historically leaned on training-data recall, although its Search mode narrows the gap with retrieval-first engines. That distinction changes what an answer reflects. Identical prompts do not make the sources behind those answers equivalent.
Source preferences create another layer of divergence. Perplexity draws heavily on user-generated content, reviews, forums, and social proof, while Claude favors authoritative and structured sources. A strong Reddit presence can therefore produce a different brand picture on Perplexity than on Gemini. Strong editorial coverage can also lead to different results on ChatGPT and Claude. These differences describe sourcing philosophies.
Consequently, a brand can hold a large share of voice on one engine and a much smaller share on another for the same prompts. That contrast is useful evidence about where its signals are effective. Averaging the outputs removes precisely that evidence. A shared dashboard is valuable only if it preserves the differences.
What AI share of voice actually measures, and why a blended manual read hides the number that matters
AI share of voice measures a company’s brand mentions relative to those of its tracked competitors across AI-generated responses. It is calculated by dividing the company’s mentions by total mentions across the tracked competitive set, expressed as a percentage. The calculation belongs at the engine level. Linked citations are a separate measure and should not be substituted for mentions without changing what the metric means.
A high share on one platform may offset weak visibility on another, leaving a reassuring average that identifies neither. The result on the weaker platform shows which sourcing philosophy and content signals need attention. The stronger result identifies a position to defend. A manual check across tabs does not reliably show which of those two tasks a team should take on.
Similarweb’s 2026 Generative AI Brand Visibility Index found that 35% of US consumers now use AI at the product discovery stage. A brand’s presence in generated answers can shape the shortlist before a buyer reaches its website. Per-engine share of voice thus measures how much buyers see a brand alongside its competitors during discovery, as well as how often an assistant repeats its name.
Why citation sets shift fast enough to make any manual snapshot misleading within days
Platform divergence is only one source of uncertainty. Citation sets also change over time, with roughly half the cited domains shifting monthly in active categories. An answer recorded on Tuesday is not a dependable description of what buyers will encounter on Friday. The monthly turnover makes the assumption of a stable citation landscape untenable.
Weekly checks miss what changes between one check and the next. Monthly checks compare citation sets that may have changed a lot, so it is hard to tell the effect of a strategy from ordinary volatility. A rise in visibility could reflect a meaningful improvement or a transient change in the sources selected. The spreadsheet alone cannot establish which interpretation is justified.
Daily querying is not a sustainable human workflow, and retrieval-heavy platforms can vary within the day as they pull live results. A manual trend line thus joins results while leaving most changes in the baseline out of view. Cross-platform differences and temporal volatility compound each other, rather than offering two independent problems that tab rotation can solve separately.
The hallucination risk that manual monitoring misses entirely
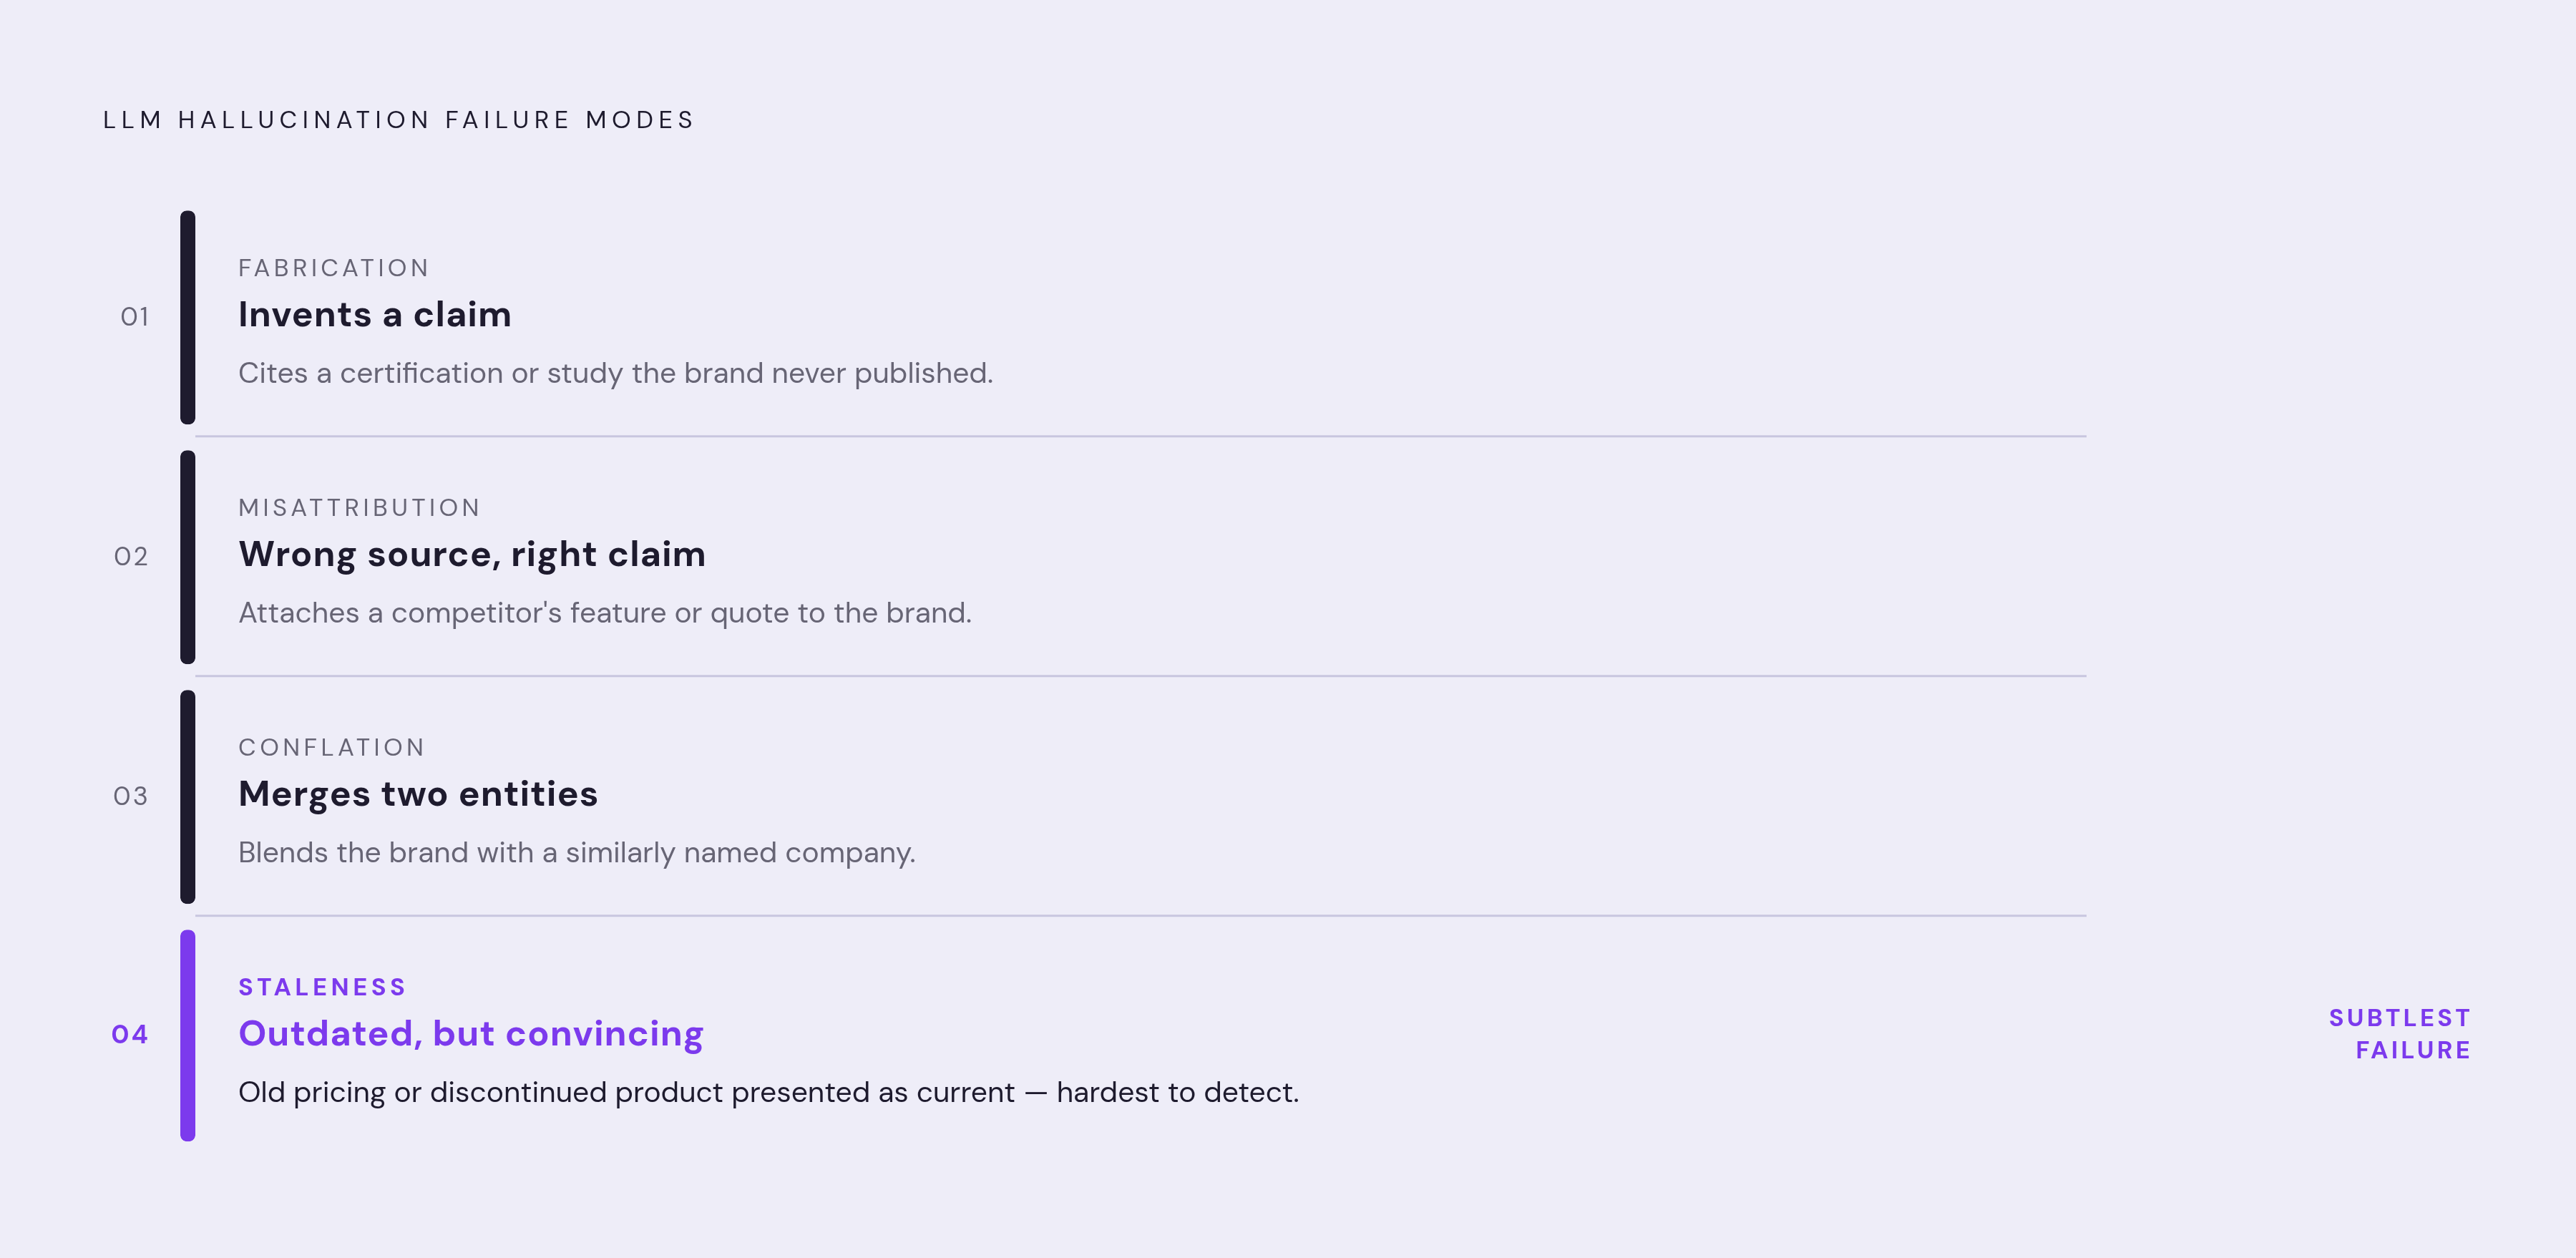
Even when a mention is recorded correctly, the information in it can be wrong. Brand hallucinations fall into four distinct failure modes, which are fabrication, misattribution, conflation, and staleness. Fabrication invents a claim, while misattribution attaches another company’s claim to the brand. Conflation merges the brand with a similarly named entity. Staleness shows old information as though it is still up to date.
A marketer may recognize an invented product or unsupported claim during a spot-check, but a competitor’s claim attached to the brand can look plausible. Conflation is similarly difficult to detect unless the reader recognizes the other entity. Staleness can be subtler still, because outdated pricing, discontinued products, or superseded leadership may appear in an otherwise convincing answer.
These errors distort buyer intelligence and brand presentation. Counting a mention as a visibility gain says nothing about whether the buyer received an accurate description. Manual monitoring can catch an individual mistake, but it cannot systematically establish accuracy across platforms and category prompts. Visibility and correctness therefore require separate measures.
Why most brands are measuring the wrong things and therefore cannot see the gap
Existing analytics often fail to register this distinction or the exposure itself. Organic traffic, keyword rankings, and click-through rate describe interactions that do not encompass a buyer receiving an answer without visiting a website. Similarweb’s zero-click research found a large rise in zero-click search resolutions between May 2024 and May 2025 after Google’s AI Overviews rollout. The measurement boundary has shifted. Traffic-based reporting sees less of the discovery process when answers absorb interactions that once produced clicks.
AI platforms often omit referrer headers, so GA4 can classify AI-referred visits as “Direct” traffic, obscuring the connection between an answer and a subsequent website session. It also means a lack of visible AI referral growth is not sufficient evidence that AI exposure has remained flat.
Generative engine optimization, or GEO, requires measures outside standard traffic reporting, including linked citations, generated brand mentions, sentiment, and share of voice across a prompt cluster. Those signals do not appear as such in Google Analytics. A brand can gain citations without seeing corresponding movement in its usual dashboards, or lose them without an early warning. The gap comes from what the tools can measure, even when teams are paying attention.
How can teams monitor brand mentions across ChatGPT, Claude, and Perplexity in one dashboard?
A monitoring system must keep tracking a defined prompt cluster across engines and keep the results for each engine. Coverage must include the brand’s own name and the category and comparison queries buyers use, including the broader fan-out query space involved in discovery. Otherwise, a dashboard may document how platforms describe a known brand while missing whether they recommend it to someone who has not yet considered it.
Citation tracking must distinguish linked sources from unlinked mentions. Share-of-voice reporting must then preserve competitive comparisons by engine and trend them over time, with mention share kept distinct from citation share. Sentiment and accuracy monitoring serve a different purpose. They assess how the brand is described and whether fabrication, misattribution, conflation, or staleness has compromised the answer.
Content gap analysis connects those observations to corrective work. It identifies category prompts that exclude the brand and the content or entity signals that may be missing. Lumar’s 2026 GEO/AEO Strategy Guide organizes the work across Technical GEO, Content GEO, Entity GEO, and Brand Authority GEO. Each pillar needs its own monitoring signal, because a composite score cannot reveal which part of the system needs attention.
Continuity is as important as the range of measures. Weekly or monthly snapshots miss changes that help teams tell whether a trend lasts or is just noise. The reporting layer must also support visibility trends, pipeline attribution, and executive communication.
What content and entity signals determine whether AI platforms cite a brand or skip it
The practical response begins with content that systems can extract and attribute. Teams should use BLUF, or Bottom Line Up Front, openers so each section gives a clear answer on its own. Original statistics, named studies, and specific figures give an engine something it can cite. Vague content is easier to synthesize without attribution. Precision therefore serves both the reader and the system selecting evidence for an answer.
Clear topic–entity connections, consistent Organization, Person, and Product schema, and credible signals across channels help AI systems understand and reference the brand. Technical access is a prerequisite for the relevant crawlers. Teams should confirm that robots.txt is not blocking GPTBot or PerplexityBot, rather than assuming that publishing content makes it accessible to those systems.
The per-engine breakdown then directs the emphasis of the work. When visibility on Claude is weak, teams need to work on authoritative editorial sources, structured content, and institutional publishers. Strong user-generated content signals do not replace that authority. When visibility on Perplexity is weak, teams need to work on reviews, forums, and social proof, including Reddit.
Teams must work on accuracy while they work on visibility. A verified “Brand Facts” page, rigorous schema, and consistent entity data across the web can raise entity confidence and reduce the likelihood of incorrect gap-filling. A larger share of inaccurate answers is not a successful outcome.
How to make AI brand visibility reportable at the executive and board level
Executive reporting must connect this work to commercial outcomes without pretending that AI is a clean last-click channel. An AI-answer touchpoint may precede a conversion through branded search, direct traffic, or organic search. Last-click attribution often misses the influence of that earlier answer. The appropriate response is a blended evidence model that combines citations and mentions, prompt-cluster share of voice, AI referral traffic, branded search lift, and pipeline influence.
That model extends the existing SEO ROI framework. Blending evidence is different from averaging away platform differences, because each signal retains its meaning and supports a separate part of the commercial argument. Marketing leaders should track leading indicators, including citations, crawler hits, and AI referral sessions, together with early revenue signals monthly.
Board reporting requires a narrower commercial focus. Its main view should contain lagging revenue measures, including AI-attributed revenue, payback period, channel mix, and trend, with leading indicators in an appendix. Competitive AI share of voice and its relationship to pipeline provide the investment frame. Discovery exposure can be measured and assessed against commercial evidence over time.
The durable asset is the history this infrastructure creates. Brands that establish it now will have evidence of how competitive visibility and pipeline influence develop as AI search grows. Those that wait will face a gap without the trend data needed to explain it. The advantage belongs to the organization that can document change, distinguish its causes, and act before the loss becomes visible in revenue.


